Get a free AI visibility report


AI share of voice is the percentage of tracked prompts where your brand appears, measured against competitors across answer engines like ChatGPT and Google AI Overviews. You measure it by tracking a defined prompt set daily. Then you count brand mentions and divide your total by the category total.
AI answer engines now sit between buyers and brands at every stage of research. When someone asks ChatGPT which tools solve their problem, the brands named in that answer shape the shortlist. This happens before a human ever visits a website. That shift makes one question central for marketing teams. How often does your brand show up when buyers ask, and how does that compare to rivals? AI share of voice is the metric that answers it. Gartner projects that traditional search engine volume will fall as buyers move to AI chatbots and virtual agents. That shift raises the stakes for measuring presence inside those answers accurately. With worldwide AI spending forecast to grow sharply in 2026, the investment context makes accurate measurement of AI presence a priority for marketing teams.
This metric is the proportion of AI answers in which your brand is mentioned, across a defined set of prompts. It is measured relative to the total mentions in your category. It is the AI-era equivalent of traditional share of voice and the wider practice of answer engine optimization. That older metric measured your slice of paid or organic search presence against competitors. The behavior is new, but the strategic idea carries over: you want to know your share of the conversation, not just whether you appear at all.
This metric sits at the top of the AI SEO measurement funnel. Mentions and citations function as impressions, the moment your brand appears in an answer. Visibility Score, the percentage of tracked prompts where a brand appears, is the primary KPI at this stage. AI-referred traffic sits at the second stage and functions like clicks, always smaller than mention volume because most AI answers do not include a clickable link. Judging the channel by clicks alone therefore understates its real influence on buyers.
Share of voice differs from a raw visibility number in one important way. Visibility tells you how often you appear. Share of voice tells you how often you appear compared to everyone else competing for the same prompts. A brand can hold a stable visibility percentage while losing share, because competitors are pulling ahead in the same answers. Tracking both together gives an accurate read of competitive standing.
The calculation is straightforward once you fix your inputs. For a defined prompt set over a defined period, count every AI answer that mentions your brand. Then divide by the total brand mentions across all competitors in the category.
AI share of voice = (your brand mentions / total category brand mentions) × 100
Two inputs decide whether the number means anything. First, the prompt set must represent the real questions buyers ask, spanning top-of-funnel problem prompts, comparison prompts, and purchase-intent prompts. A narrow set skews the result. Your prompt universe is larger than most teams assume, so the goal is to cover the full range rather than sample a handful of obvious queries.
Second, the competitor set must be defined deliberately. If you count only two rivals, your share looks inflated. If you count every tangential brand an answer names, it looks deflated. Fix a competitor list that reflects your actual market, then hold it constant so period-over-period comparisons stay valid.
Teams often stumble on what belongs in the denominator. Some measure share against total possible mentions, meaning every prompt counts whether or not any brand appears. Others measure share only against prompts where at least one brand is named. The second approach usually gives a cleaner competitive read, because it isolates the answers where a purchasing conversation is actually happening. Whichever you choose, document it and apply it consistently, since switching mid-measurement breaks trend data.
Measuring it across answer engines follows a repeatable process. The steps below turn the formula into an operational workflow.
Start by building your prompt set. Group prompts into topic clusters that map to buyer intent, then expand each cluster until it reflects the real spread of questions in your category. Aim for breadth, because gaps in the prompt set become blind spots in the metric.
Next, define your competitor list and your denominator rule, as described above. Lock both before you collect data.
Then collect answers on a consistent cadence. This is where measurement discipline matters most. AI answers change frequently as models update and as content across the web shifts, so a single snapshot captures one moment rather than a trend. Daily monitoring is the minimum standard for reliable share-of-voice data. Anything slower risks missing swings that a competitor could exploit before you notice.
After collection, count mentions per brand per prompt, apply the formula, and segment the result. Segmentation by platform, topic cluster, and region reveals where you lead and where you trail. A brand might hold strong share in ChatGPT while lagging in Google AI Overviews, and only segmented data surfaces that gap. Improving a weak surface starts with the tactics covered in how to improve AI search visibility.
Finally, track sentiment alongside share. Sentiment analysis tells you whether the AI describes your brand positively, negatively, or neutrally, which reflects brand perception at scale. A high share of voice paired with negative sentiment is a different problem from a low share, and the fix differs too.
You can measure share of voice manually by prompting each engine, recording answers in a spreadsheet, and tallying mentions. This works for a one-time audit but breaks down as a routine. The volume of prompts multiplied by platforms multiplied by daily cadence quickly exceeds what a person can sustain. Manual sampling also captures API responses rather than the rendered answer a real user sees, which can differ. Dedicated AI-driven SEO tools for share-of-voice measurement automate collection and calculation, which is what makes daily tracking across a full prompt universe practical.
Several answer engine optimization share of voice tools track brand mentions across AI platforms. The options below differ in platform coverage, methodology, and pricing. When choosing among AI-driven SEO tools for share-of-voice measurement, weigh how accurately each vendor captures the real answer, not just how many platforms it lists.
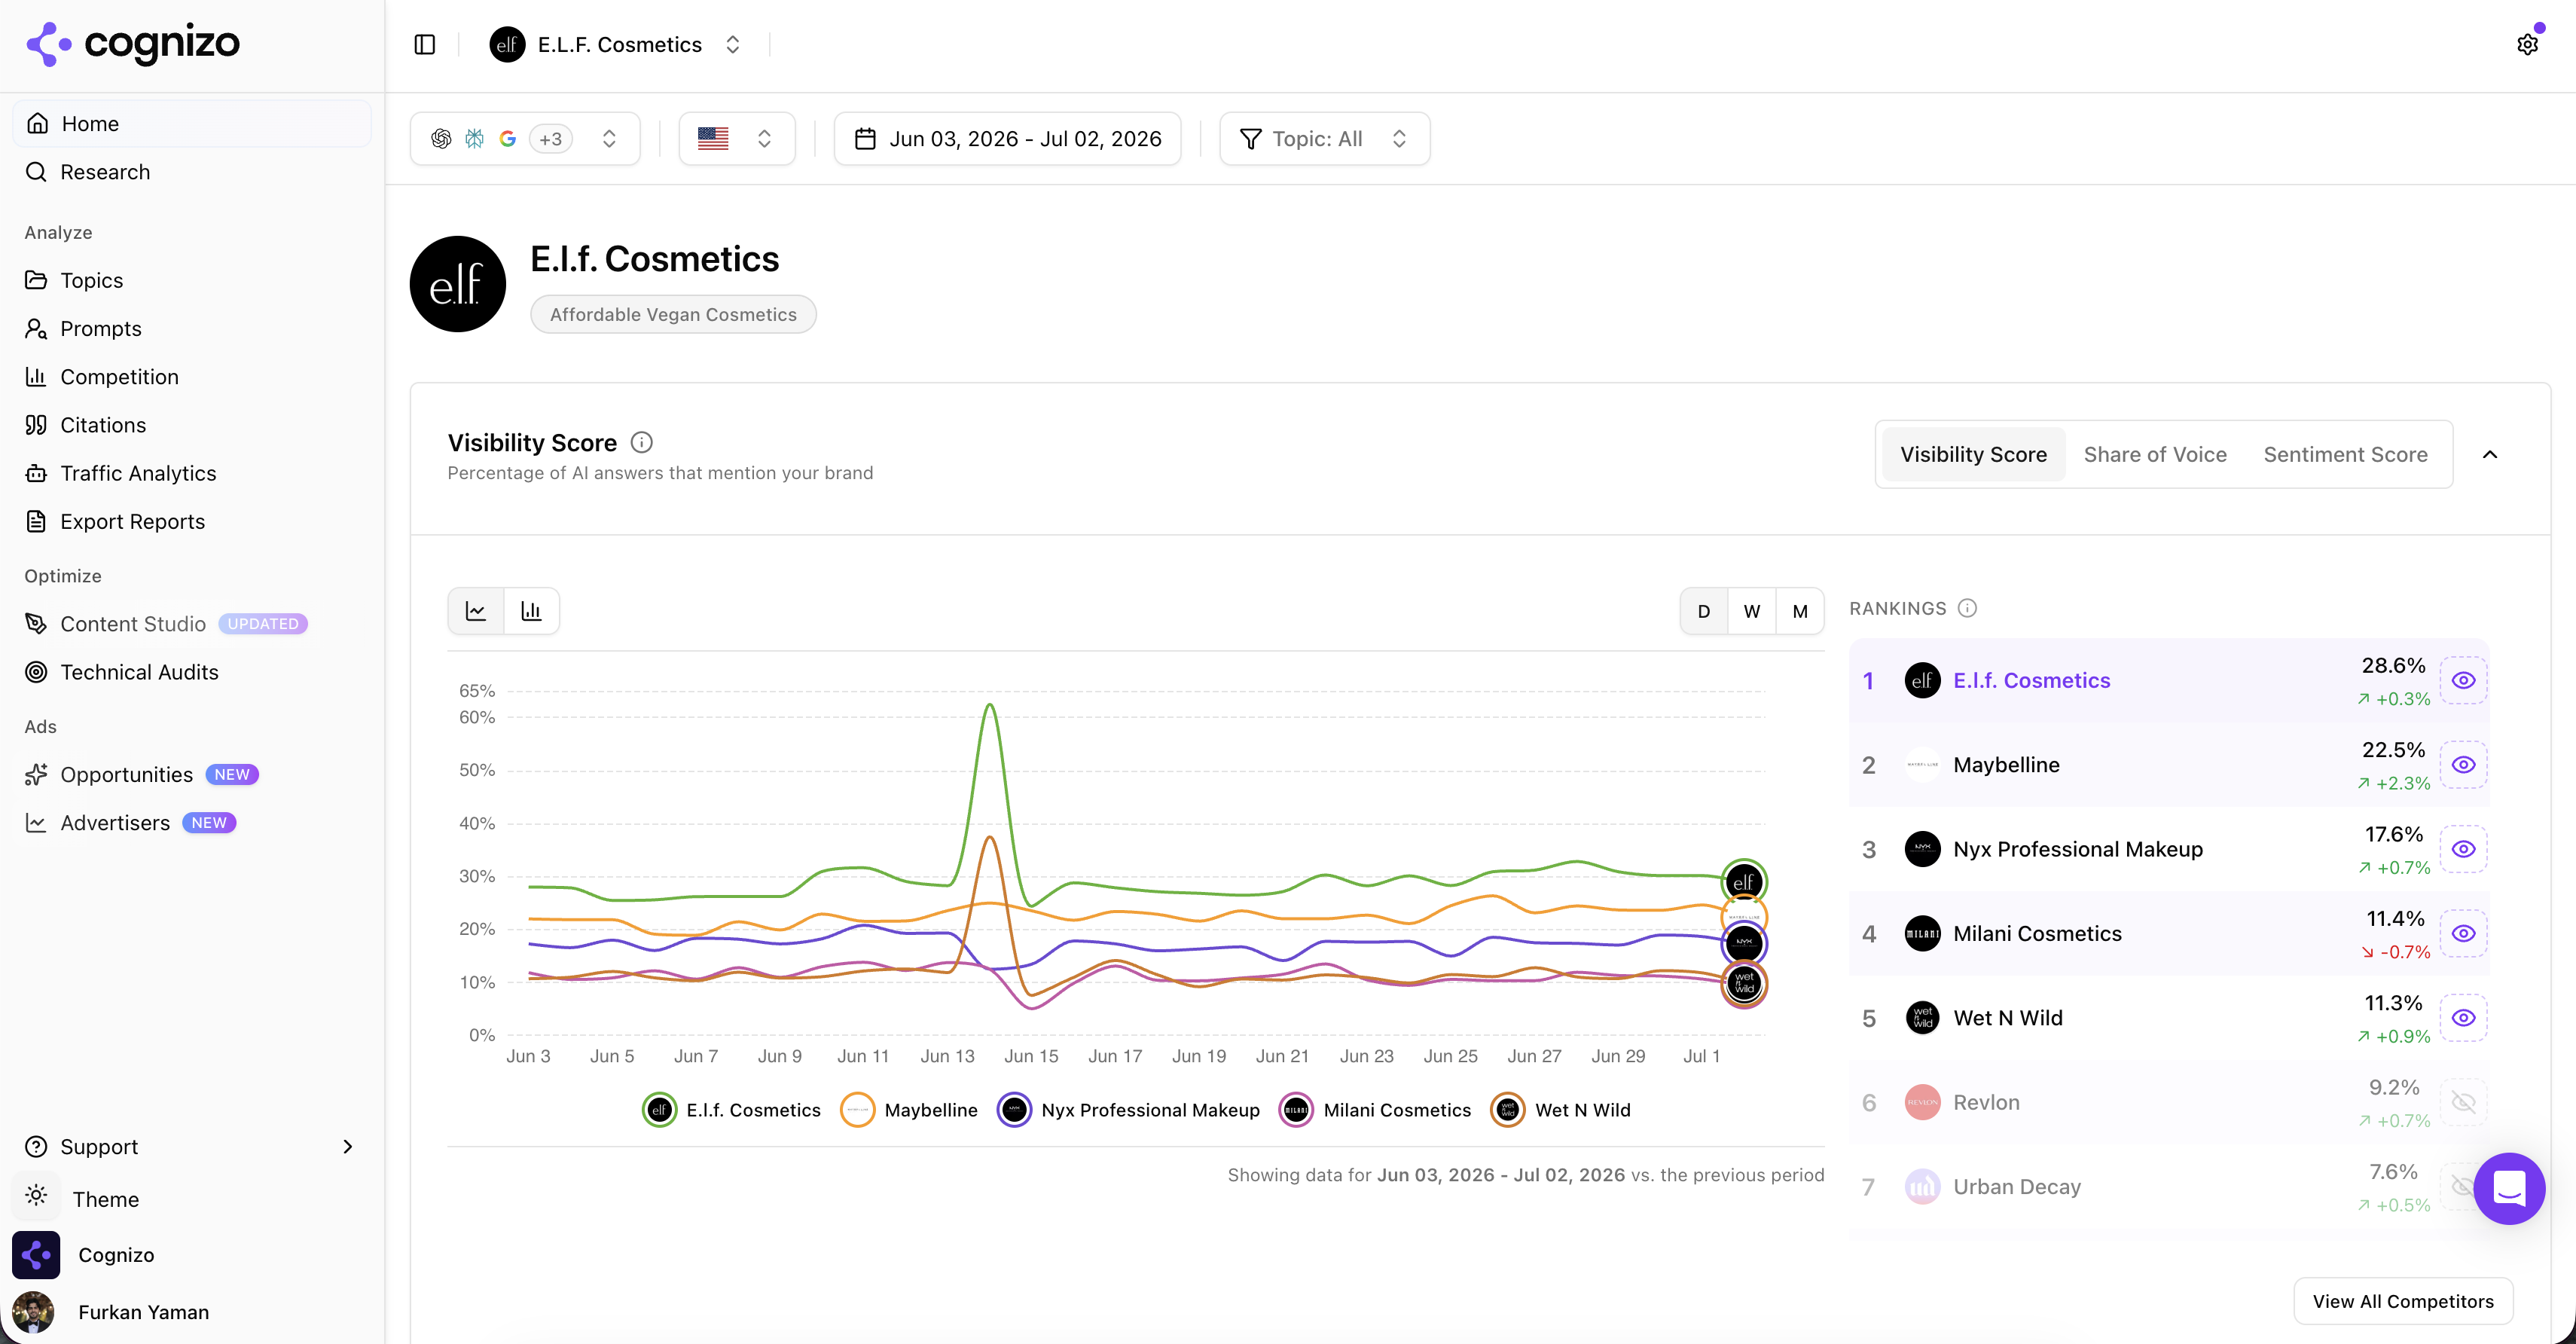
Cognizo tracks AI share of voice through its Answer Engine Insights module. That module monitors visibility, sentiment, owned citations, and earned citations across ChatGPT, Google AI Overviews, Google AI Mode, Gemini, Perplexity, Microsoft Copilot, Meta AI, Claude, Grok, and DeepSeek. Its AI content studio generates optimization briefs, outlines, drafts, and FAQs to act on the gaps the data reveals. Cognizo uses UI scraping to capture the actual rendered answer a real user would see, rather than relying solely on API responses. This improves accuracy for share-of-voice measurement. Results break down by model, topic, prompt, and region. The Prompt Volumes module reveals what buyers actually ask, built on billions of real-world signals, so prompt sets reflect real demand rather than guesswork. Cognizo includes unlimited seats on every plan, starting at $499/mo on Growth, with Pro at $999/mo. For teams weighing the cost, the value shows in outcomes. Hat Club tracked AI visibility with Cognizo. Although roughly 1 in 50 of its visitors came from AI referral traffic, that traffic drove 20x revenue growth.
Peec AI tracks brand mentions and share of voice across three to seven or more AI platforms and includes unlimited users on its plans, starting at €85/mo.
Ahrefs Brand Radar tracks brand mentions across six AI platforms, priced at $199/mo per platform, and connects to the broader Ahrefs backlink and keyword data set.
Buyers often ask for a single target number, but a universal benchmark does not exist here. The reason is structural. Share is relative, so the meaningful comparison is always against the specific competitors in your prompt set, not an industry-wide figure. A 15% share might lead a fragmented category with ten active brands. The same 15% might trail badly in a category dominated by two players.
Set benchmarks using your own competitive context. Establish a baseline across your prompt set, identify the leader in your category, and measure the gap. Track that gap over time, because the direction of change matters more than the absolute number. Rising share against a stable competitor set signals that your content and reputation work is landing.
Segment benchmarks by platform as well. Because citation logic differs across engines, your share in ChatGPT will rarely match your share in Perplexity or Google AI Overviews. Setting one blended target hides these differences, so benchmark each surface separately and prioritize the platforms where your buyers actually research.
Category structure also shapes what good looks like. In categories with heavy third-party coverage, earned citations make up a large share of total mentions. Earned citations are cases where AI mentions your brand but links to a review site or comparison article. In those categories, improving share often means influencing what third-party sources say, not only optimizing your own pages.
Several errors distort this data. Avoiding them keeps the metric trustworthy.
The most common mistake is measuring too infrequently. A monthly or quarterly snapshot treats a constantly changing system as if it were static, which produces misleading trends. Continuous, daily measurement is the minimum standard, because it captures the real volatility of AI answers.
A second mistake is sampling too few prompts. Teams often test a handful of obvious queries and treat the result as representative. It rarely is. The prompt universe is larger than most teams assume. A small sample overweights whatever those specific prompts happen to favor and hides the rest of the buyer conversation.
A third mistake is judging the channel by referral clicks alone. Most AI answers do not link out, so referral traffic will always undercount influence. UTM tracking has a further blind spot, since buyers who see a mention and later search the brand directly never appear in referral data. Complement UTM tracking with a "how did you hear about us" field in demo and signup flows. Give it an explicit AI option to close that gap.
A fourth mistake is changing the measurement definition mid-stream. Swapping the competitor set or the denominator rule between periods breaks comparability and makes trend lines meaningless. Lock the definition first, then measure against it consistently.
Measure daily. AI answers shift as models update and as web content changes, so a monthly or quarterly reading captures a single moment rather than a trend. Daily monitoring is the minimum standard because it surfaces swings early, before a competitor gains ground you cannot easily recover. Continuous tracking also builds the volume of data points needed to separate real movement from day-to-day noise. Tools that automate collection make daily measurement across a full prompt set practical, which manual spreadsheet tracking cannot sustain at scale.
You can run a manual audit at no cost by prompting each engine, recording the answers, and tallying mentions in a spreadsheet. Some platforms also offer free entry tiers. The limitation is sustainability: manual measurement across a full prompt set, multiple platforms, and a daily cadence quickly exceeds what a person can maintain. Free manual sampling also captures a moment rather than a trend. It usually reads API responses instead of the rendered answer a real user sees. It works for a one-time snapshot but not for ongoing competitive tracking.
No, it complements them. Traditional SEO metrics measure ranking and click behavior in search results. This metric measures presence inside AI-generated answers, where many buyers now research. The two describe different surfaces of the same customer journey. As buyers split their research across traditional search and answer engines, tracking only one leaves half the picture dark. Measure both, and connect them through a shared view of where prospects encounter your brand and what they do next.
There is no universal target, because share of voice is relative to your competitors in a specific prompt set. A share that leads a fragmented category could trail a concentrated one. Instead of chasing an absolute number, establish a baseline, identify your category leader, and measure the gap between you. Track the direction of that gap over time. Rising share against a stable competitor set indicates progress, regardless of the raw percentage. That direction is the reading that actually informs strategy.
Visibility Score is the percentage of tracked prompts where your brand appears, measured on its own. AI share of voice places that appearance in competitive context by comparing your mentions to the total mentions across your category. A brand can hold a steady Visibility Score while its share of voice falls, because competitors are appearing more often in the same answers. Visibility tells you whether you show up; share of voice tells you how you rank against everyone else competing for the same prompts.
Yes. Each answer engine uses different citation logic. Your share in ChatGPT will rarely match your share in Perplexity, Gemini, or Google AI Overviews. A single blended figure hides these differences and can mask a serious gap on a platform your buyers rely on. Segment by platform, then prioritize the surfaces where your audience actually researches. ChatGPT and Google AI Overviews warrant primary focus for most teams, with other platforms weighted according to where your specific buyers spend time.
Earned citations often make up a large share of total AI mentions. These are cases where AI names your brand but links to a third-party source like a review site or comparison article. In categories with heavy third-party coverage, your share of voice depends significantly on what those external sources say about you. Improving share in these cases means influencing reviews, comparison content, and press coverage, not only optimizing your own pages. Tracking whether mentions are owned or earned shows where your share is coming from and where to focus reputation work.
.svg)

.svg)


